climate change
Design out CO2
30% reduction in CO2 per tonne of product compared to 1990.
"Using waste from other industries as fuel for our cement kilns is an excellent way both of contributing to the circular economy and of reducing CO2 emissions. "
Mike Eberlin, managing director, Cement and Lime
Addressing climate change is a cornerstone of our approach to sustainability.
highlights
We have continued to embed the ISO 50001 energy management standard across our business throughout 2018. We use this standard to drive continuous improvement in energy and CO2 efficiency. We set every site a specific energy and CO2 target and require each to generate an energy reduction opportunities assessment.
This process is supported by the sharing of best practice energy efficiency measures across relevant operations. Our ISO 50001 system helps us to ensure all our operations are compliant with regulatory requirements, such as the UK government’s Energy Savings Opportunity Scheme (ESOS).
Using lower CO2 fuels
Our Cement business has maintained its focus on the use of waste-derived fuels, especially those that have a biomass content. This helps reduce CO2 emissions arising from our cement manufacturing process. By using waste-derived fuels we not only reduce our CO2 emissions, we conserve valuable natural resources and help to reduce the amount of waste that goes to landfill. In 2018, 34% of the heat input to our cement kilns was produced from waste-derived fuels, including 12.3% from biomass. The types of fuels used across our cement operations now include waste tyres (whole or chipped), solid recovered fuel (SRF) from non-hazardous materials including paper, cardboard, plastics, textiles and waste wood chips, recycled liquid fuel, processed sewage pellets (PSP) and polymer chip. Fuels such as waste wood chips and PSP are 100% biomass while tyres, SRF and polymer chip contain a proportion of biomass. The use of fuels containing biomass makes a significant contribution to reducing CO2 emissions as biomass is considered carbon neutral.
We also utilise landfill gas from a neighbouring Viridor site at our cement plant at Dunbar, Scotland and within our materials business we have continued to convert our asphalt plants to lower CO2 fuels, for by switching from the use of gas oil to natural gas or LPG.
Reducing transport impact and emissions
We continue to work hard to optimise our use of transport and utilise a range of methods to transport product to our customers in the most efficient manner. The nature of the construction sector means that moving raw materials and product by road transport often remains the best and most energy efficient option. It’s therefore important to ensure we use our vehicle fleet effectively; sourcing from the nearest supply and maximising vehicle payloads to minimise the number of trips required. We have a rolling programme of upgrading the vehicles used by our contract hauliers and require them to move to new vehicles with the latest generation of Euro VI engines.
We have invested in high tech fuel monitoring equipment on our marine dredging vessels to ensure we have the best possible understanding of our fuel use on board.
We also understand the need to minimise exhaust emissions to meet current and planned low emission zones in cities. This is already well established in London, with an ultra-low emission zone and with other local authorities across England set to follow in creating their own low-emission zones.
Our rail strategy has a big part to play in reducing emissions in urban areas and we have increased the volume of material moved by rail this year by continuing to invest in new rail handling facilities and rail sidings. For example, we are now running 15 more trains a week, through new routes and have reconnected sites with rail capabilities at our sites in Port Talbot, Bristol and Thrislington.
Future Innovation
We’re working in partnership with researchers and others in our industry to develop solutions for capturing CO2 emissions in the future. Approximately 70% of CO2 from cement production is generated from the chemical reactions (process emissions), the other 30% coming from the fuels (combustion emissions). The process emissions are difficult to reduce. We are therefore looking into ways to capture carbon and use it to make downstream products or transport it for storage in bespoke facilities, such as old gas fields.
A significant proportion of the constituent materials used to make our products are purchased local to source and road transport is often the most appropriate mode of transport. We continue to work hard to improve the way we use our vehicles. This has included maximising payloads to minimise the number of trips required. We also try to ensure where possible that we supply from the nearest available unit and plan delivery routes to avoid congestion. We regularly upgrade our fleet and are encouraging our contract hauliers to move to the latest generation of Euro VI engines. We have also invested in high tech fuel monitoring equipment on our marine dredging vessels to ensure we have the best possible understanding of our fuel use on board.
In 2017 we continued to invest in our rail facilities delivering on our commitment to transport more of our products by rail. In 2017, we opened a brand new rail aggregates handling depot at Garston, South Liverpool. This new operation, created in partnership with Freightliner and Rail Freight Services provides an additional 300,000 tonnes a year aggregate handling capacity, supplying customers in Merseyside and Cheshire. In 2017 we moved over 9 million tonnes of product by rail - the equivalent to removing 450,000 lorries load from our roads.
We continue to support our customers and end users to create more energy efficient, lower carbon buildings and infrastructure by considering the whole-life (capital and operational) carbon associated with our products by redesigning and rethinking the way we make them. Among options we consider are:
- improving durability, meaning that products need to be replaced or maintained less frequently - Read our Ultigrip case study.
- using recycled or secondary materials in products, such as ground granulated blast furnace slag and fly ash instead of clinker to reduce the capital CO2 in cement or used road surfacing (Recycled Asphalt Planings) instead of primary materials in asphalt
- creating new products that have a lower carbon footprint – such as
- Carbon8 aggregates - Read our Carbon8 case study
- Ultilow our lower temperature asphalt, which is manufactured at lower temperatures, saving both energy and CO2
- providing customers with product carbon footprint information generated from our calculator tool that measures carbon across a project enabling better choices about design and what materials to use. Read more on tarmac.com
- raising awareness of the benefits of our materials in use through Solution Guides. Read our low carbon solution guide here.
Tarmac is a key signatory of the UK Government’s Infrastructure Carbon Review (ICR) which aims to cut 24 million tonnes CO2 from UK infrastructure projects by 2050. In support of the ICR we have played an active role in the development of a new publicly available standard PAS 2080, the world’s first specification for Carbon Management in Infrastructure. Read it here.
At the end of 2018 we had achieved a 24.1% reduction in CO2 per tonne of product compared to 1990. Our next milestone is to achieve a 30% reduction in CO2 per tonne compared to 1990.
We categorise our greenhouse gas emissions into direct and indirect sources in line with the Greenhouse Gas Protocol.
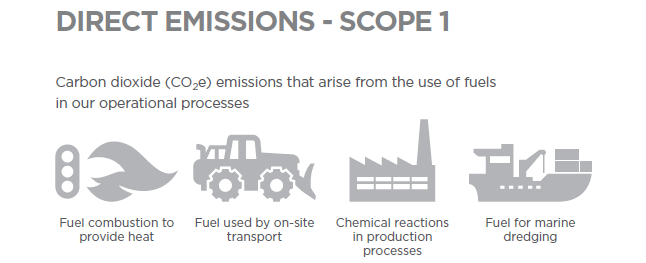
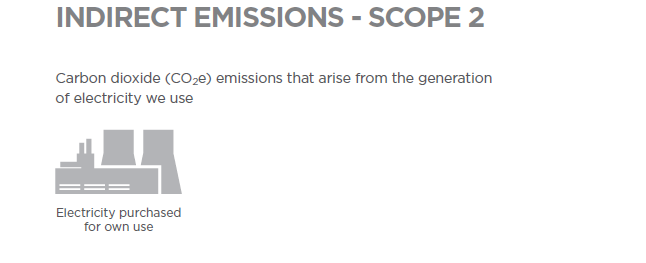
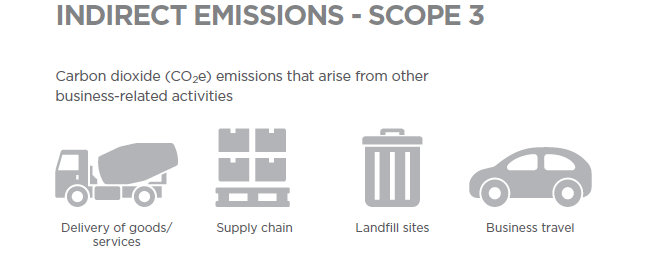
Carbon dioxide is one of six greenhouse gases that are emitted when humans undertake certain activities. Other greenhouse gases include methane, nitrous oxide and ozone – all of which occur naturally in our atmosphere. To take into account the emission of other greenhouse gases when calculating the level of greenhouse gas emissions, scientists have devised an equivalent measure – CO2e (which literally means carbon dioxide equivalent). CO2e allows other greenhouse gas emissions to be expressed in terms of CO2 based on their relative global warming potential (GWP).
So when you see a carbon footprint expressed in terms of CO2e, you can know for sure that all greenhouse gases have been included for each activity under scope, and therefore a fuller picture of an organisation's impact has been captured.
| 1000’s tCO2e | % | |
|---|---|---|
| Scope 1 | 2,362.2 | 84.4% |
| Scope 2 | 143.5 | 5.1% |
| Scope 3 | 294.0 | 10.5% |
| 2,799.6 | 100% |
| tCO2e | % | |
|---|---|---|
| Process emissions | 1,326,010 | 54.8% |
| Coal | 341,982 | 14.1% |
| Electricity | 143,471 | 5.9% |
| Waste derived fuel (WDF) | 111,850 | 4.6% |
| Natural gas | 204,635 | 8.5% |
| Gas oil | 128,141 | 5.3% |
| Petcoke | 48,760 | 2.0% |
| Processed fuel oil (PFO) | 40,431 | 1.7% |
| Kerosene | 19,202 | 0.8% |
| Marine Diesel | 19,350 | 0.8% |
| Liquid Petroleum Gas (LPG) | 35,861 | 1.5% |
| Energy use by source (GJ) | % | |
|---|---|---|
| Coal | 3,628,703 | 24.8% |
| Electricity | 1,824,632 | 12.4% |
| Waste derived fuel (WDF) | 1,211,009 | 8.3% |
| Natural gas | 4,140,446 | 28.2% |
| Gas oil | 1,682,709 | 11.4% |
| Petcoke | 520,790 | 3.5% |
| Processed fuel oil (PFO) | 543,289 | 3.7% |
| Kerosene | 278,998 | 1.9% |
| Marine Diesel | 238,000 | 1.7% |
| Liquid Petroleum Gas (LPG) | 597,422 | 4.1% |
| Total | 14,665,998 | 100.00% |
